Naujienos

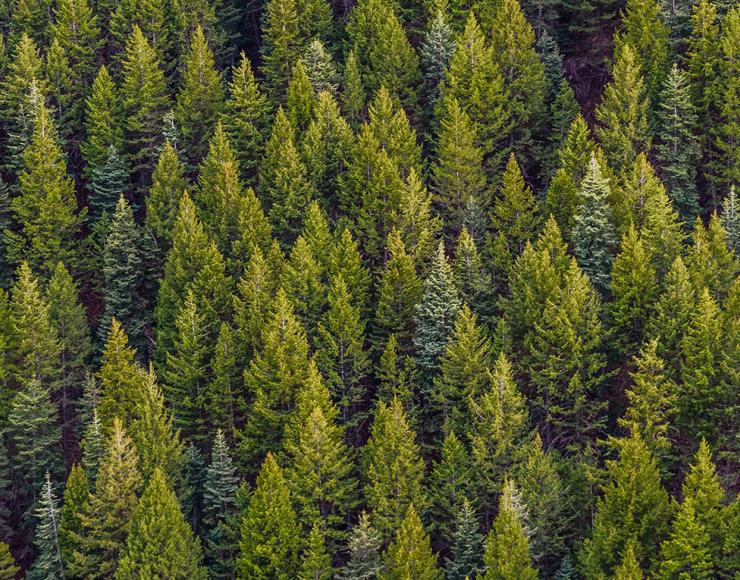
VMT: Vyksta pasaulinė miško resursų apskaita FRA_ 2015
Valstybinė miškų tarnyba 2014.08.04 skelbia Pasaulinės miško resursų apskaitos FRA_2015 suvestinius rezultatus apie Lietuvos miškų išteklius. Jungtinių Tautų Žemės ūkio ir maisto organizacija (FAO) vykdo pasaulio miškų išteklių stebėseną 5 -10 metų intervalais nuo 1946 m. Paskutinieji vertinimo duomenys ( FRA 2010) pateikiami čia...>>>2013 metais prasidėjo FAO organizuojami ir metodiškai vadovaujami Pasaulinės miško resursų apskaitos FRA_2015 parengiamieji darbai.
[VMT 2013.05.17 pranešė, kad startavo pasaulinė miškų apskaita FRA – 2015 ir Europos – SOEF – 2015]
Po daugiau kaip metus trukusio kruopštaus darbo, Valstybinės miškų tarnybos specialistų grupė parengė atsakymus į apskaitos oganizatorių klausimyną, kurį sudaro daugiau kaip 20 temų apie miškų charakteristikas, miškų ūkio veiklą, miškų politiką.
Visiems pateiktiems rodikliams privalėjo būti nurodyti jų šaltinai ir duomenų patikimumo bei tikslumo lygiai. Reikalingi duomenys apie 2015 metus pagal darbo metodiką yra prognoziniai, gauti analizuojant ankstesnių apskaitų rezultatų kitimo tendencijas.
VMT pateikia šios apskaitos suvestinius rodiklius (anglų k.):
 |
 |
FRA_2015 Lithuania country report |
||||||||
| Variables / TOPIC | Unit | 1990 | 2000 | 2005 | 2010 | 2015 | ||
|---|---|---|---|---|---|---|---|---|
| TOPIC I: Forest Area and Forest Characteristics | ||||||||
| 1a | ||||||||
| 1.1 Forest | 1000 ha | 1945 | 2020 | 2121 | 2170 | 2180 | ||
| 1.2 Other wooded land | 1000 ha | 80 | 83 | 73 | 84 | 104 | ||
| 1.3 Other land | 1000 ha | 4243 | 4165 | 4074 | 4013.5 | 3983.5 | ||
| 1.3.1 ... of which with tree cover | 1000 ha | 63 | 62 | 63 | 63 | 63 | ||
| 1.4 Inland water bodies | 1000 ha | 262 | 262 | 262 | 262.5 | 262.5 | ||
| 1b | ||||||||
| Annual forest establishment / loss (000 hectares per year) } | ||||||||
| 1.6 Forest expansion | 1000 ha/yr | N/A | 6.896 | 7.838 | 9.956 | |||
| 1.6.1 ... of which afforestation | 1000 ha/yr | N/A | 0.576 | 2.418 | 3.469 | |||
| 1.6.2 ... of which natural expansion of forest | 1000 ha/yr | N/A | 6.32 | 5.42 | 6.487 | |||
| 1.7 Deforestation | 1000 ha/yr | N/A | 0.048 | 0.088 | 0.037 | |||
| 1.7.1 ... of which human induced | 1000 ha/yr | N/A | 0.048 | 0.088 | 0.037 | |||
| 1.8 Reforestation | 1000 ha/yr | N/A | N/A | 17.95 | 15.8 | |||
| 1.8.1 ... of which artificial | 1000 ha/yr | N/A | N/A | 8.19 | 8.7 | |||
| ...of which of introduced species (000 hectares per year) } | ||||||||
| 1.6 Forest expansion | 1000 ha/yr | N/A | 0 | 0 | 0 | |||
| 1.6.1 ... of which afforestation | 1000 ha/yr | N/A | 0 | 0 | 0 | |||
| 1.6.2 ... of which natural expansion of forest | 1000 ha/yr | N/A | 0 | 0 | 0 | |||
| 1.7 Deforestation | 1000 ha/yr | N/A | 0 | 0 | 0 | |||
| 1.7.1 ... of which human induced | 1000 ha/yr | N/A | 0 | 0 | 0 | |||
| 1.8 Reforestation | 1000 ha/yr | N/A | 0.0020 | 0.0010 | 0 | |||
| 1.8.1 ... of which artificial | 1000 ha/yr | N/A | 0.0020 | 0.0010 | 0 | |||
| 2a | ||||||||
| 2.1 Primary forest | 1000 ha | 20 | 21 | 26 | 26 | 26 | ||
| 2.2 Other naturally regenerated forest | 1000 ha | 1514 | 1538 | 1604 | 1614 | 1584 | ||
| 2.1.1 ... of which of introduced species | 1000 ha | 0 | 0 | 0 | 0 | 0 | ||
| 2.1.1.1 ... of which naturalized | 1000 ha | 0 | 0 | 0 | 0 | 0 | ||
| 2.3 Planted forest | 1000 ha | 411 | 461 | 491 | 530 | 570 | ||
| 2.3.1 ... of which of introduced species | 1000 ha | 3 | 3 | 3 | 3 | 3 | ||
| 2b | ||||||||
| 2.4 Primary forest converted to (000 ha) | 1000 ha | 0, 0, 0 | 0, 0, 0 | 0, 0, 0 | ||||
| 2c | ||||||||
| 2.5 Mangroves (forest and OWL) | 1000 ha | 0 | 0 | 0 | 0 | 0 | ||
| 2.5.1 ... of which planted | 1000 ha | 0 | 0 | 0 | 0 | 0 | ||
| TOPIC II: Production | ||||||||
| 3a | ||||||||
| 3.1 Total forest growing stock | million m3 | 413 | 449.5 | 464.6 | 489.8 | 515 | ||
| 3.1.1 ... of which coniferous | million m3 | 234.8 | 255 | 262.7 | 281.9 | 301.1 | ||
| 3.1.2 ... of which broadleaved | million m3 | 178.2 | 194.5 | 201.9 | 207.9 | 213.9 | ||
| 3.2 Total other wooded land growing | million m3 | 2.4 | 2.5 | 2.2 | 2.5 | 3.1 | ||
| 3.2.1 ... of which coniferous | million m3 | 0 | 0 | 0 | 0 | 0 | ||
| 3.2.2 ... of which broadleaved | million m3 | 2.4 | 2.5 | 2.2 | 2.5 | 3.1 | ||
| 3b | ||||||||
| 3.3.1 Rank } 1st | million m3 | 150.1 | 162.9 | 168.1 | 182.8 | |||
| 3.3.2 Rank } 2nd | million m3 | 84.7 | 92 | 94.5 | 99 | |||
| 3.3.3 Rank } 3rd | million m3 | 69.1 | 75.2 | 78.2 | 81.8 | |||
| 3.3.4 Rank } 4th | million m3 | 28.9 | 33.2 | 36.5 | 40.7 | |||
| 3.3.5 Rank } 5th | million m3 | 32.3 | 31.2 | 30.2 | 31 | |||
| 3.3.6 Rank } 6th | million m3 | 16 | 19.8 | 21.8 | 20.8 | |||
| 3.3.7 Rank } 7th | million m3 | 12.8 | 13.4 | 13.6 | 13.3 | |||
| 3.3.8 Rank } 8th | million m3 | 10.3 | 11.3 | 10.5 | 8.5 | |||
| 3.3.9 Rank } 9th | million m3 | 2.6 | 3.5 | 3.9 | 4.2 | |||
| 3.3.10 Rank } 10th | million m3 | 1.3 | 1.8 | 2.1 | 2.1 | |||
| 3.3.11 Rank } Remaining | million m3 | 4.9 | 5.2 | 5.2 | 5.6 | |||
| 3c | ||||||||
| 3.4 Net annual increment | m3/ha/yr | N/A | N/A | 5.8 | 5.8 | 6.4 | ||
| 3.4.1 ... of which coniferous | m3/ha/yr | N/A | N/A | 6.6 | 7.2 | 7.3 | ||
| 3.4.2 ... of which broadleaved | m3/ha/yr | N/A | N/A | 5 | 4.4 | 5.5 | ||
| 3d | ||||||||
| Forest | ||||||||
| 3.5 Above ground biomass | million tonnes | 217.9 | 237.1 | 245.2 | 257.9 | 271.1 | ||
| 3.6 Below ground biomass | million tonnes | 50.1 | 54 | 56.4 | 59.3 | 62.4 | ||
| 3.7 Dead wood | million tonnes | 19.5 | 20.3 | 21.2 | 21.7 | 21.8 | ||
| Other wooded land | ||||||||
| 3.5 Above ground biomass | million tonnes | 1.3 | 1.3 | 1.2 | 1.3 | 1.6 | ||
| 3.6 Below ground biomass | million tonnes | 0.3 | 0.3 | 0.3 | 0.3 | 0.4 | ||
| 3.7 Dead wood | million tonnes | 0.1 | 0.1 | 0.1 | 0.1 | 0.1 | ||
| 3e | ||||||||
| Forest | ||||||||
| 3.8 Carbon in above ground biomass | million tonnes | 109 | 118.6 | 122.6 | 129 | 135.6 | ||
| 3.9 Carbon in below ground biomass | million tonnes | 25.1 | 27 | 28.2 | 29.7 | 31.2 | ||
| 3.10 Carbon in dead wood | million tonnes | 9.8 | 10.2 | 10.6 | 10.9 | 10.9 | ||
| 3.11 Carbon in litter | million tonnes | 46.7 | 48.5 | 50.9 | 52.1 | 52.2 | ||
| 3.12 Soil carbon | million tonnes | 140 | 145.4 | 152.7 | 156.2 | 157 | ||
| Other wooded land | ||||||||
| 3.8 Carbon in above ground biomass | million tonnes | 0.65 | 0.65 | 0.6 | 0.65 | 0.8 | ||
| 3.9 Carbon in below ground biomass | million tonnes | 0.15 | 0.15 | 0.15 | 0.15 | 0.2 | ||
| 3.10 Carbon in dead wood | million tonnes | 0.05 | 0.05 | 0.05 | 0.05 | 0.05 | ||
| 3.11 Carbon in litter | million tonnes | 1.9 | 2 | 1.8 | 2.05 | 2.5 | ||
| 3.12 Soil carbon | million tonnes | 5.8 | 6.4 | 5.3 | 6 | 7.5 | ||
| 4a | ||||||||
| 4.1 Production forest | 1000 ha | 1412.0 | 1466.0 | 1494.0 | 1549.0 | 1550.0 | ||
| 4.2 Multiple use forest | 1000 ha | 127.0 | 132.0 | 158.0 | 163.0 | 163.0 | ||
| 4b | ||||||||
| Commercial value of NWFP removals 2010 (value 1000 local currency) | 1000 local currency | 58249 | ||||||
| 4c | ||||||||
| Total wood removals | Pre-filled data from FAOSTAT | |||||||
| ...of which woodfuel | ||||||||
| TOPIC III: Protective Functions and Selective Ecosystem Services | ||||||||
| 5a | ||||||||
| 5.1 Protection of soil and water | 1000 ha | 171 | 178 | 210 | 192 | 199 | ||
| 5.1.1 ... of which production of clean water | 1000 ha | 0 | 0 | 0 | 0 | 0 | ||
| 5.1.2 ... of which coastal stabilization | 1000 ha | 155 | 159 | 183 | 167 | 174 | ||
| 5.1.3 ... of which desertification control | 1000 ha | 0 | 0 | 0 | 0 | 0 | ||
| 5.1.4 ... of which avalanche control | 1000 ha | 0 | 0 | 0 | 0 | 0 | ||
| 5.1.5 ... of which erosion, flood protection or reducing flood risk | 1000 ha | 16 | 19 | 27 | 25 | 25 | ||
| 5.1.6 ... of which other (please specify in comments below the table) | 1000 ha | 0 | 0 | 0 | 0 | 0 | ||
| 5b | ||||||||
| 5.2 Ecosystem services, cultural or spiritual values | 1000 ha | 75 | 78 | 66 | 65 | 63 | ||
| 5.2.1 ...of which public recreation (sub-category) | 1000 ha | 75 | 78 | 66 | 65 | 63 | ||
| 5.2.2 ...of which carbon storage or sequestration (sub-category) | 1000 ha | 0 | 0 | 0 | 0 | 0 | ||
| 5.2.3 ...of which spiritual or cultural services (sub-category) | 1000 ha | 0 | 0 | 0 | 0 | 0 | ||
| 5.2.4 ...of which other (please specify in comments below the table) | 1000 ha | 0 | 0 | 0 | 0 | 0 | ||
| TOPIC IV: Biodiversity / Conservation | ||||||||
| 6 | ||||||||
| 6.1 Conservation of biodiversity | 1000 ha | 160 | 166 | 193 | 201 | 205 | ||
| 6.2 Forest area within protected areas | 1000 ha | N/A | 395 | 424 | 454 | 460 | ||
| TOPIC V: Disturbance and Forest Degradation | ||||||||
| 7 | ||||||||
| Scientific name of woody invasive species | 1000 ha | 0 | 0 | |||||
| 8a | ||||||||
| 8.1 Total land area burned | 1000 ha | N/A, 13.301, 4.063, 33.798, 3.294, 5, 13, 5.878, 5, 5 | ||||||
| 8.1.1 ... of which forest area burned | 1000 ha | 0.436, 0.253, 0.051, 1.199, 0.038, 0.112, 0.315, 0.022, 0.293, 0.02 | ||||||
| 8.2 Total land area burned | Number | N/A, 3740, 2587, 8584, 2465, 5553, 7233, 4346, 4443, 3856 | ||||||
| 8.2.1 ... of which forest area burned | Number | 885, 468, 301, 1545, 251, 301, 507, 110, 142, 81 | ||||||
| 8b | ||||||||
| Area damaged (000 hectares) } | 1000 ha | 154.5 | ||||||
| 9 | ||||||||
| 9.1 Reduction in canopy cover | 1000 ha | N/A | ||||||
| TOPIC VI: Measuring Progress Toward SFM i: National-scale enabling environment for SFM |
||||||||
| 10 | ||||||||
| 10.1 Policies supporting sustainable forest management | Boolean | Yes | No | No | No | |||
| 10.1.1 ... of which, in publicly owned forests | Boolean | Yes | No | No | No | |||
| 10.1.2 ... of which, in privately owned forests | Boolean | Yes | No | No | No | |||
| 10.2 Legislation and regulations supporting sustainable forest management | Boolean | Yes | No | No | No | |||
| 10.2.1 ... of which, in publicly owned forests | Boolean | Yes | No | No | No | |||
| 10.1.2 ... of which, in privately owned forests | Boolean | Yes | No | No | No | |||
| 11 | ||||||||
| 11.1 Is there a national platform that promotes or allows for stakeholder participation in forest policy development? | Boolean | Yes | ||||||
| 12 | ||||||||
| 12.1 Forest area intended to be in permanent forest land use | 1000 ha | 2170 | ||||||
| 12.1.1 ... of which permanent forest estate | 1000 ha | 2170 | ||||||
| 13a | ||||||||
| % of total forest area | Most recent year | Checkboxes | ||||||
| 13.1 Forest inventory | %,year,checkboxes | 100 | 2013 | Yes, Yes, Yes, Yes, No, Yes | ||||
| 13.2 Other field assessments | %,year,checkboxes | , , , , , | ||||||
| 13.3 Updates to other sources | %,year,checkboxes | , , , , , | ||||||
| 13.4 Expert estimate | %,year,checkboxes | |||||||
| 13b | ||||||||
| 13.5 Type of forest reporting used at national scale | ||||||||
| 13.5.1 1 Criteria and Indicators reporting | Boolean | Yes | ||||||
| 13.5.2 2 Periodic national state of the forest report | Boolean | Yes | ||||||
| 13.5.3 3 Other (please document) | Boolean | No | ||||||
| 13.5.4 4 None | Boolean | No | ||||||
| TOPIC VI: Measuring Progress Toward SFM ii: Operational scale progress toward SFM |
||||||||
| 14a | ||||||||
| 14.1 Forest area with management plan | 1000 ha | 2170 | ||||||
| 14.1.1 ... of which for production | 1000 ha | 1879 | ||||||
| 14.1.2 ... of which for conservation | 1000 ha | 291 | ||||||
| 14b | ||||||||
| 14.2.1 1 Soil and water management | Boolean | Yes | ||||||
| 14.2.2 2 High conservation value forest delineation | Boolean | Yes | ||||||
| 14.2.3 3 Social considerations community involvement | Boolean | Yes | ||||||
| 14c | ||||||||
| 14.3 Percent of area under forest management plan that is monitored annually | % | 20 | ||||||
| 15 | ||||||||
| 15.1 Please indicate the type of stakeholder involvement in forest management decision making required in your country | ||||||||
| 15.1.1 1. Planning phase | Boolean | yes | ||||||
| 15.1.2 2. Operations phase | Boolean | no | ||||||
| 15.1.3 3. Review of operations | Boolean | no | ||||||
| 16a | ||||||||
| 16.1 International forest management certification | ||||||||
| 16.1.1 FSC | 1000 ha | 0, 0, 66.14, 448.57, 644.8, 1005.53, 1007.34, 1044.32, 677.09, 976.94, 1033.2, 1049.41, 1055.35 | ||||||
| 16.1.2 PEFC | 1000 ha | 0, 0, 0, 0, 0, 0, 0, 0, 0, 0, 0, 0, 0 | ||||||
| 16.1.3 Other | 1000 ha | N/A, N/A, N/A, N/A, N/A, N/A, N/A, N/A, N/A, N/A, N/A, N/A, N/A | ||||||
| 16b | ||||||||
| 16.2 Domestic forest management certification | ||||||||
| 16.2.1 Not applied | 1000 ha | N/A, N/A, N/A, N/A, N/A, N/A, N/A, N/A, N/A, N/A, N/A, N/A, N/A | ||||||
| 16.2.2 | 1000 ha | , , , , , , , , , , , , | ||||||
| 16.2.3 | 1000 ha | , , , , , , , , , , , , | ||||||
| TOPIC VII: Economics / Livelihoods | ||||||||
| 17 | ||||||||
| 17.1 Forest revenue | 1000 local currency | 64033 | 89384 | 135500 | ||||
| 17.2 Public expenditure on forestry | 1000 local currency | 12385 | 13000 | 25400 | ||||
| 18a | ||||||||
| 18.1 Public ownership | 1000 ha | 1945 | 1562 | 1404 | 1333 | |||
| 18.1.1 ... of which owned by the state at national scale | 1000 ha | 1945 | 1562 | 1404 | 1333 | |||
| 18.1.2 ... of which owned by the state at the sub-national government scale | 1000 ha | 0 | 0 | 0 | 0 | |||
| 18.2 Private ownership | 1000 ha | 0 | 458 | 717 | 837 | |||
| 18.2.1 ... of which owned by individuals | 1000 ha | 0 | 458 | 705 | 792 | |||
| 18.2.2 ... of which owned by private business entities and institutions | 1000 ha | 0 | 0 | 12 | 45 | |||
| 18.2.3 ... of which owned by local, tribal and indigenous communities | 1000 ha | 0 | 0 | 0 | 0 | |||
| 18.3 Unknown ownership | 1000 ha | 0 | 0 | 0 | 0 | |||
| 18b | ||||||||
| 18.4 Public Administration | 1000 ha | 1945 | 1562 | 1404 | 1333 | |||
| 18.5 Individuals | 1000 ha | 0 | 0 | 0 | 0 | |||
| 18.6 Private companies | 1000 ha | 0 | 0 | 0 | 0 | |||
| 18.7 Communities | 1000 ha | 0 | 0 | 0 | 0 | |||
| 18.8 Other | 1000 ha | 0 | 0 | 0 | 0 | |||
| 19 | ||||||||
| 19.1 Employment in forestry | 1000 FTE | 14.6 | 13.7 | 9.8 | 9 | |||
| 19.1 ... of which female | 1000 FTE | N/A | N/A | N/A | N/A | |||
| 20 | ||||||||
| 20.1 Gross value added from forestry (at basic prices) | 1000 local currency | 479.7 | ||||||
| TOPIC VIII: Looking Forward | ||||||||
| 21a | ||||||||
| 21.1 Government target/aspiration for forest area | 1000 ha | 2233.0, N/A | ||||||
| 21b | ||||||||
| 21.2 Forests earmarked for conversion | 1000 ha | 0.0 | ||||||
Šaltinis: amvmt.lt